Data visualisation with Cube
![]() Credit card transactions visualised with Cube
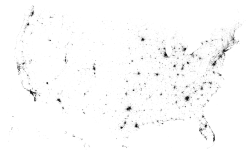
Credit card transactions visualised with Cube
Source: square.github.com/cube/
The open source Cube system offers a NoSQL and HTML5-based environment for visualising time series data. Originally conceived for internal data analysis by Square, a US-based company that provides electronic payment services using iOS and Android mobile devices, Cube has now been released by its developers as an open source project on GitHub under the Apache License 2.0.
Cube itself is based on the MongoDB NoSQL database, uses Node to execute server-side JavaScript, and uses the D3 library for manipulating presentations in a browser. The system accepts events submitted via JSON (which may also contain structured data) and visualises the aggregate metrics. For this purpose, Cube provides a graphical interface which is said to make it easy for users to create appropriate dashboards.
The developers are planning to add further visualisation components to Cube in the future. Although, they say that it is also possible to develop custom components – apparently, this approach is used at Square itself, for instance to map the density of transactions made using the company's own credit card billing system.
The developers point out that Cube is a work in progress and that future updates are likely to involve changes that will not be backwards compatible. They have called on anyone who is interested in contributing to the development of the system to contact them via GitHub.
(crve)
![Kernel Log: Coming in 3.10 (Part 3) [--] Infrastructure](/imgs/43/1/0/4/2/6/7/2/comingin310_4_kicker-4977194bfb0de0d7.png)

![Kernel Log: Coming in 3.10 (Part 3) [--] Infrastructure](/imgs/43/1/0/4/2/3/2/3/comingin310_3_kicker-151cd7b9e9660f05.png)